 habstick
The day, in one sentence
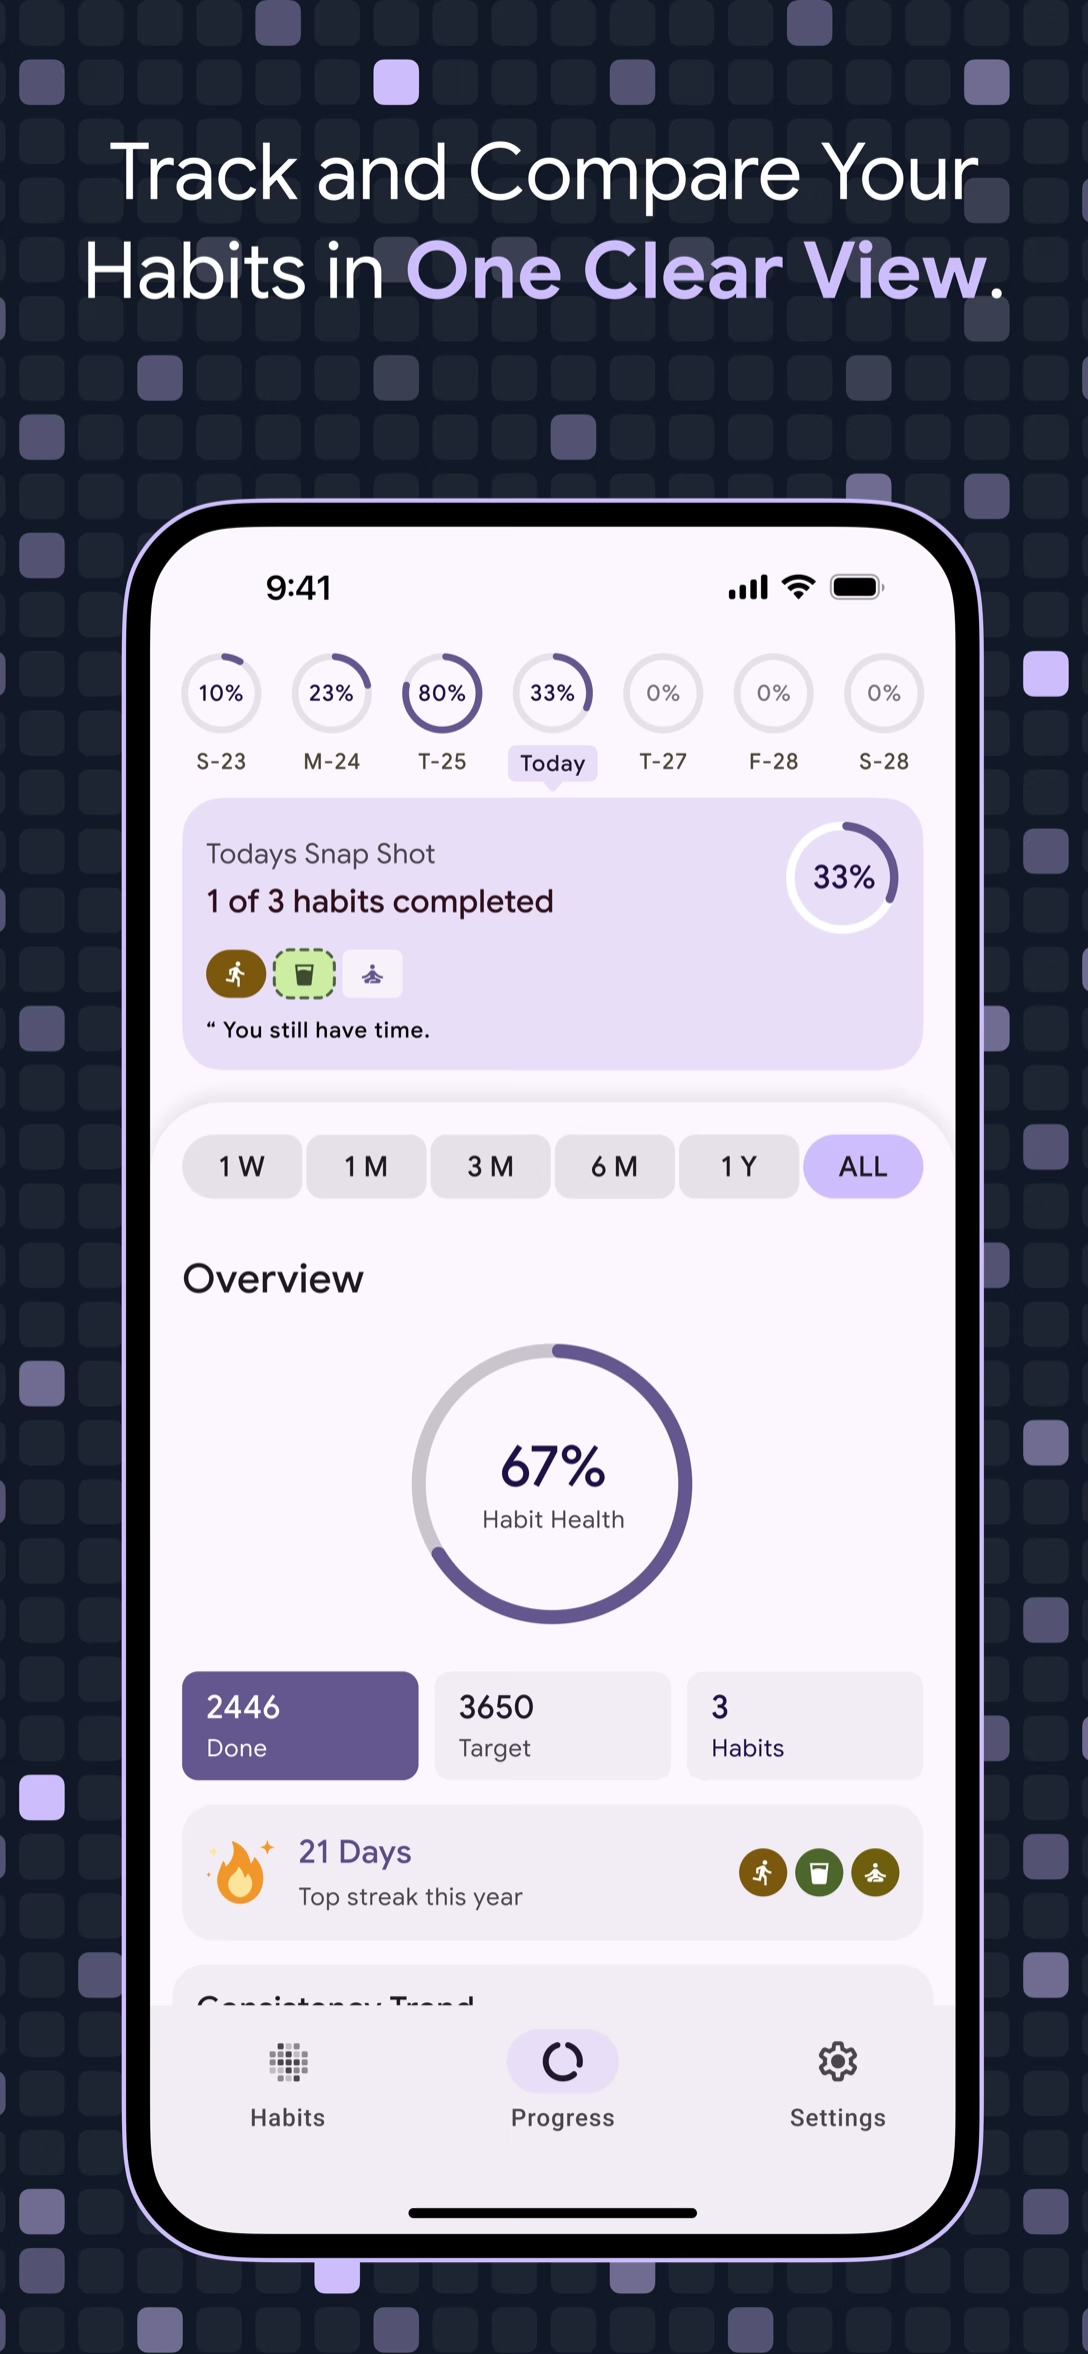
The Progress tab opens with a count of completed versus total habits for today, plus a plain line that tells you whether there is still time.
Last updated .
The Progress tab opens with a plain answer to a simple question: how is today going? From there, HabStick shows the last seven days, streaks, and a consistency trend built from your own check-ins.
A streak counter answers one question: is the chain still alive? It cannot tell you that you finished eighteen of twenty workouts this month, that reading is your steadiest habit, or that one missed Tuesday was a blip rather than a pattern. Questions like those need a wider view than a single number—one that holds weeks and months, and shows where the pattern bends.
HabStick’s Progress tab starts with Today’s Snapshot, a plain line about how the day is going so far. Below it, you choose a range—This Week, This Month, Last 3 Months, Last 6 Months, This Year, or All Time—and the summary, chart, and habit list rebuild for that range. Habit Health, your top streak, totals against target, and the Consistency Trend all come from check-ins stored on your device.
Minimalist design that respects your time and attention.
The Progress tab opens with a count of completed versus total habits for today, plus a plain line that tells you whether there is still time.
A seven-day row shows the completed percentage for each of the last seven days, so a single bad afternoon no longer looks like a lost week.
Habit Health condenses your consistency into one percentage, and the summary adds your top streak, total completed against target, and habit count.
A Consistency Trend chart plots habit completion across the selected range, per habit where relevant, so progress reads as a direction instead of a verdict.
Every view reads the same local check-ins, just at a different distance.
Completed versus total habits for today, with a short line when the day is not finished yet.
A row of seven days, each showing that day’s completed percentage.
One percentage for the whole routine, sitting beside your top streak, totals, and habit count.
The summary names your top streak for the selected range, while each habit card keeps its own current and top streaks.
Habit completion plotted over the selected range, per habit where relevant, so the direction is visible.
Each habit listed with completed versus target for the range, so gaps are easy to spot.
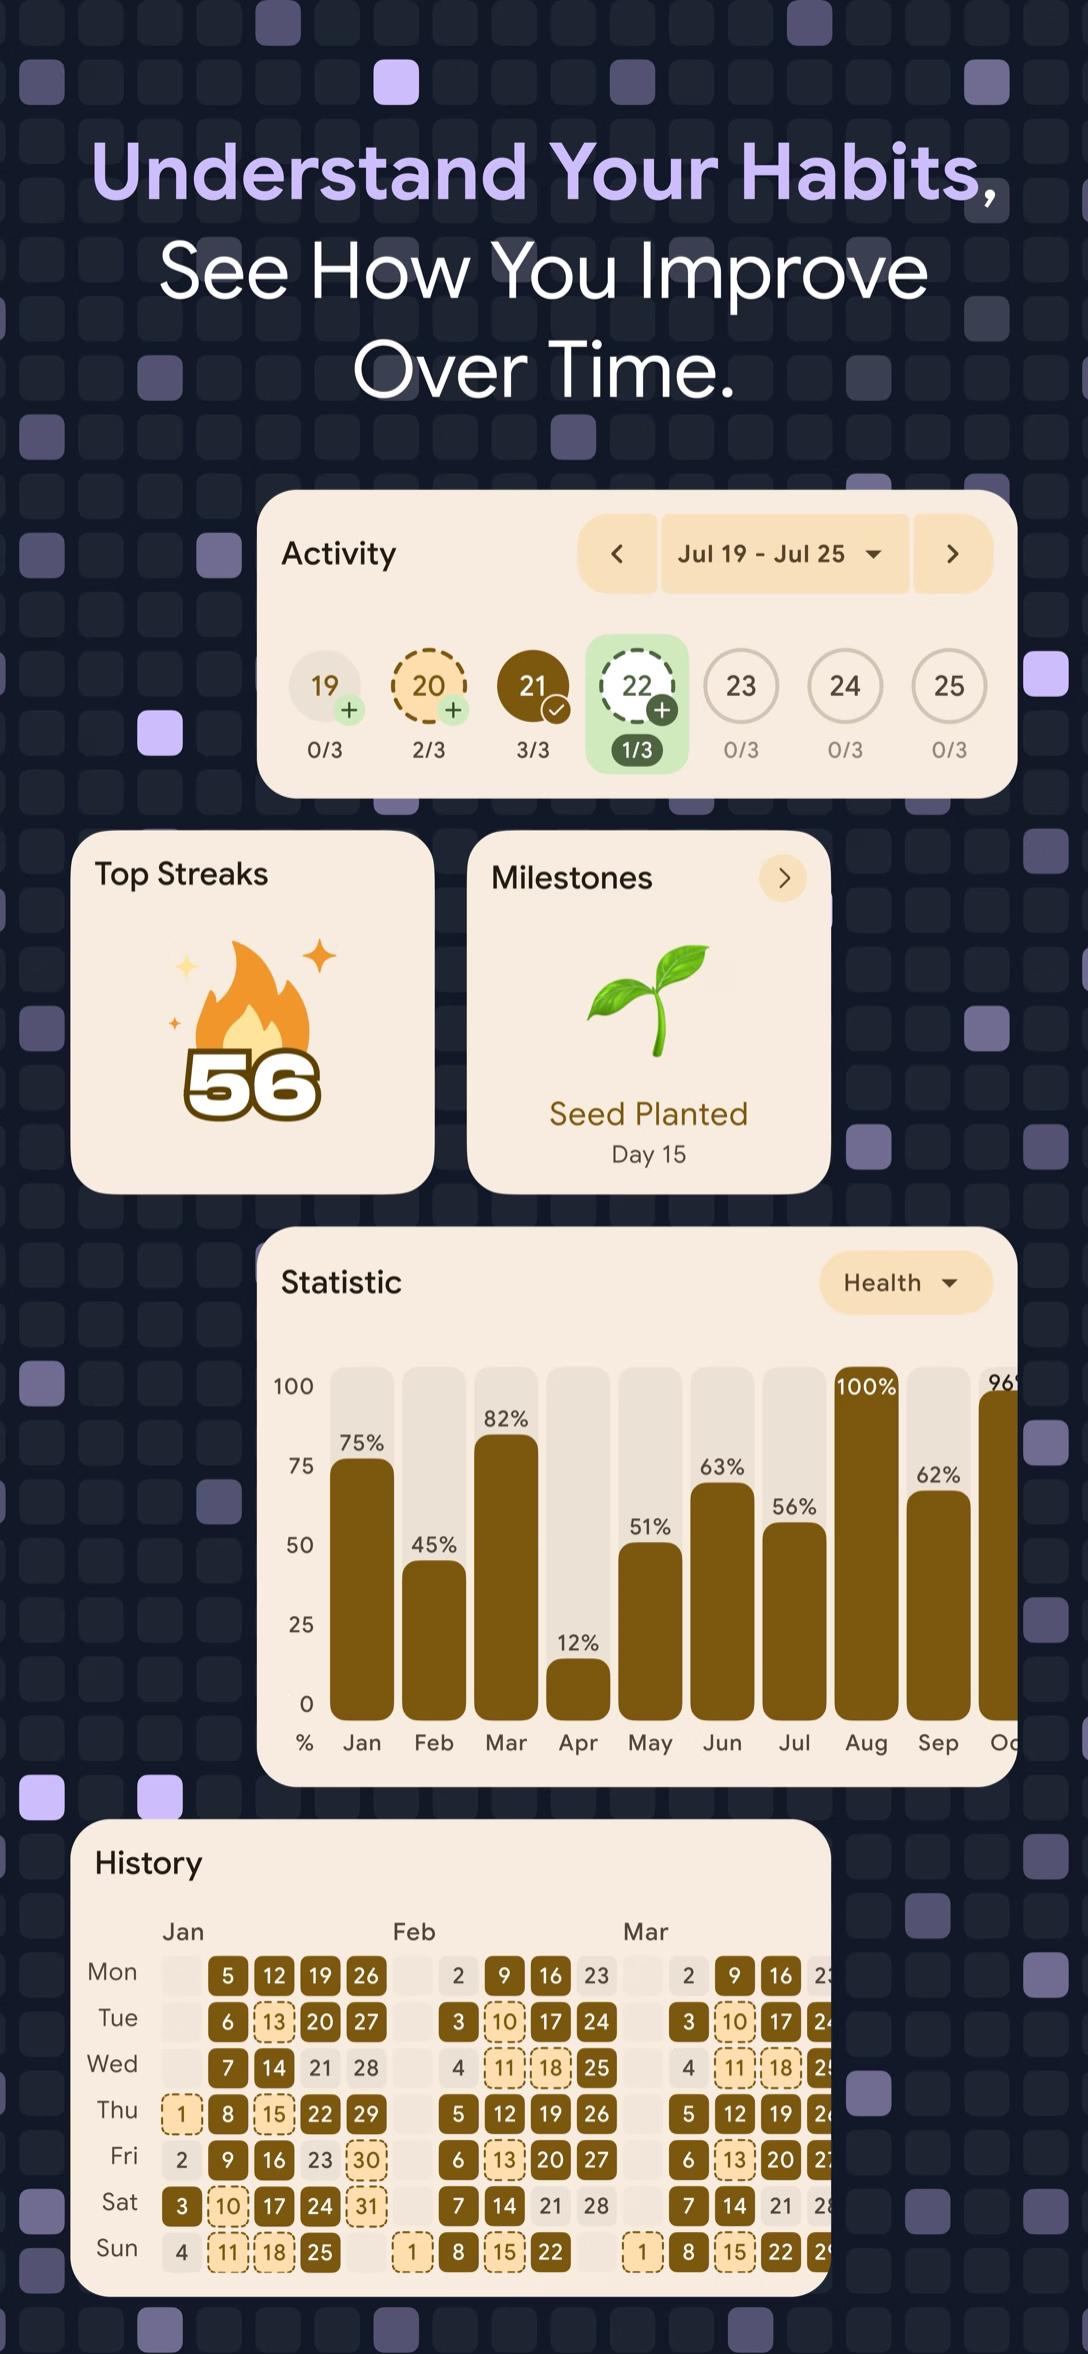
A habit’s card includes an activity-by-date view and a history heatmap for the check-ins behind the numbers.
Everything is computed on your device from local data, so no analytics account is needed.
Pick a range, read the trend, then open any habit that needs attention.
The tab opens with Today’s Snapshot: completed habits against the total, plus a short line about whether time is still on your side.
Choose This Week, This Month, Last 3 Months, Last 6 Months, This Year, or All Time. The summary, chart, and habit list follow the range.
Habits Overview lists every habit with completed versus target. Open one to see its completion percentage, total finished, total missed, current streak, top streak, activity by date, and history heatmap.
Explore more HabStick capabilities:
Today’s Snapshot, which counts completed habits against the total for the day and adds a short line like “You still have time.” when the day is not finished.
Six: This Week, This Month, Last 3 Months, Last 6 Months, This Year, and All Time. The summary, chart, and habit list all follow the selected range.
Habit Health is a percentage that summarizes your consistency for the chosen range, shown beside your top streak, your total completed against target, and the number of habits.
It plots habit completion across the selected range, per habit where relevant, so you can see whether the routine is trending up, holding steady, or slipping.
It shows the completed percentage for each of the last seven days—a quick weekly read before you zoom out to a longer range.
Each habit card shows its own completion percentage for the range, total finished, total missed, current streak, top streak, an activity-by-date view, and a history heatmap.
No. Everything is computed on your device from local data, and no analytics account is needed.
The All Time range covers your full record, and each habit keeps a history heatmap plus an activity-by-date view of its check-ins.
Free to start on iOS and Android. No login, no clutter—just your habits.